Install K3s, Prometheus and Grafana in 5 minutes
I’m excited to announce that I will be creating a tutorial on how to install k3s with Prometheus and Grafana. As you may already know, setting up and configuring these tools can be a very time-consuming task, especially if you’re not familiar with the process. That’s why I’m here to provide you with a step-by-step tutorial that will enable you to install these tools in just 5 minutes!
K3s is a lightweight Kubernetes distribution that is designed for use in production environments with limited resources, making it an ideal choice for small-scale and edge deployments. Prometheus is an open-source monitoring and alerting tool that collects and stores time-series data, while Grafana is a popular data visualization platform that allows you to create interactive dashboards and visualizations.
By combining these tools, you can gain valuable insights into your Kubernetes cluster’s performance and health, making it easier to identify and troubleshoot issues. However, setting up this stack can be a daunting task, especially if you’re not familiar with the process.
That’s why I’m excited to provide you with a comprehensive tutorial that will guide you through the entire process step-by-step, from installing k3s to configuring Prometheus and Grafana. With my tutorial, you’ll be able to install and configure this powerful monitoring stack in just 5 minutes, saving you a lot of time and effort.
So, stay tuned for my tutorial and get ready to simplify your monitoring stack installation process like never before!
Install K3s and Helm
- Create two directories for storing the etcd snapshots and backups:
cd && mkdir etcd-snapshots && mkdir etcd-backups
- Configure snapshots to occur every 3 hours and retain the last 72 snapshots (9 days):
curl -sfL https://get.k3s.io | sh -s server - --cluster-init --token "1234" --write-kubeconfig-mode 644 --disable traefik --data-dir=/home/david/etcd-backups --etcd-snapshot-retention=72 --etcd-snapshot-dir=/home/david/etcd-snapshots --etcd-snapshot-schedule-cron="*/3 * * * *"
- Add an alias for kubectl: vim .bashrc then add this line:
alias k=kubectl
- Install Helm:
sudo snap install helm --classic && export KUBECONFIG=/etc/rancher/k3s/k3s.yaml
Install Prometheus and Grafana
- Clone the k3s-monitoring repository:
git clone https://github.com/cablespaghetti/k3s-monitoring.git; cd k3s-monitoring
- Add the Prometheus Helm chart repository:
helm repo add prometheus-community https://prometheus-community.github.io/helm-charts
- Install Prometheus and Grafana:
helm upgrade --install prometheus prometheus-community/kube-prometheus-stack --version 39.13.3 --values kube-prometheus-stack-values.yaml
- Edit the service for Grafana to use a NodePort:
kubectl edit service/prometheus-grafana
- Then change the type to NodePort and save.
- Access Grafana: http://<your-k3s-node-ip>:<nodeport>/login. Use the following credentials to login:
- user: admin
- pass: prom-operator
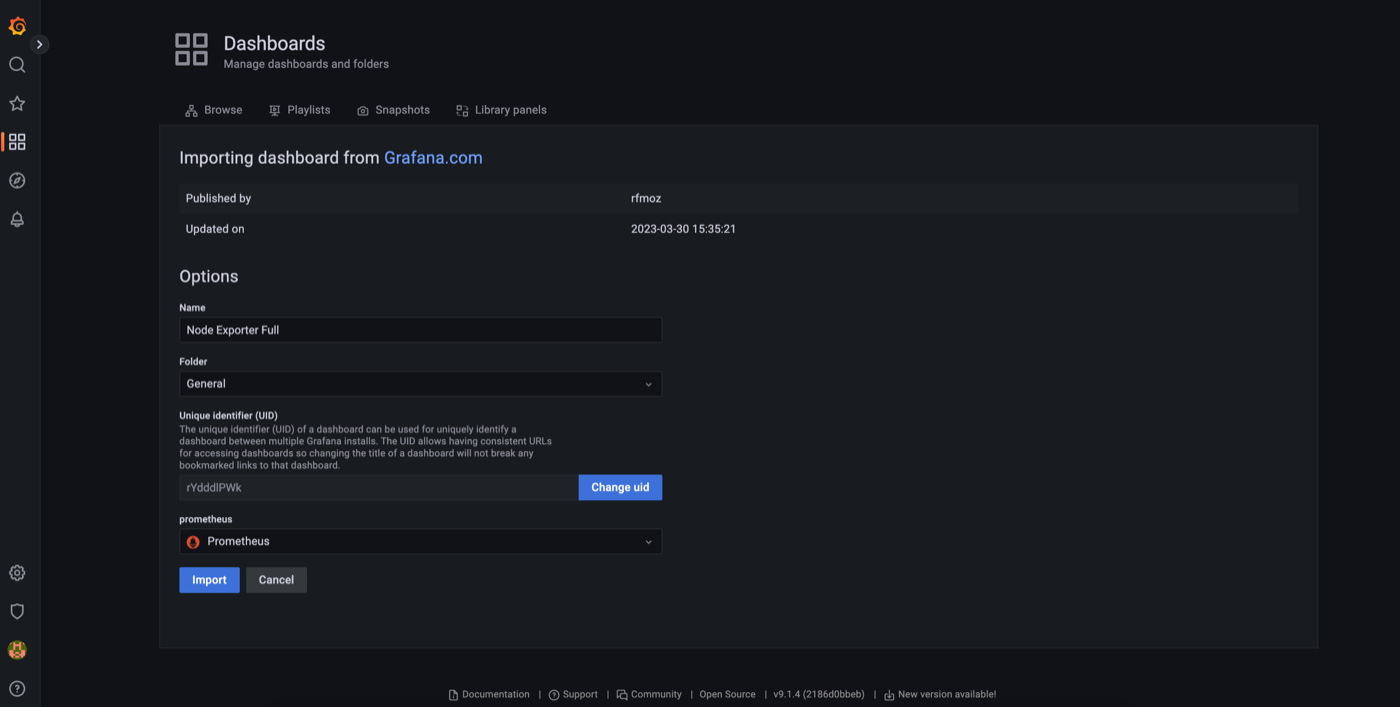
- Import the desired dashboards.
- just type 1860 on the search to find the node exporter dashboard. This gives the complete vision on the node resources.
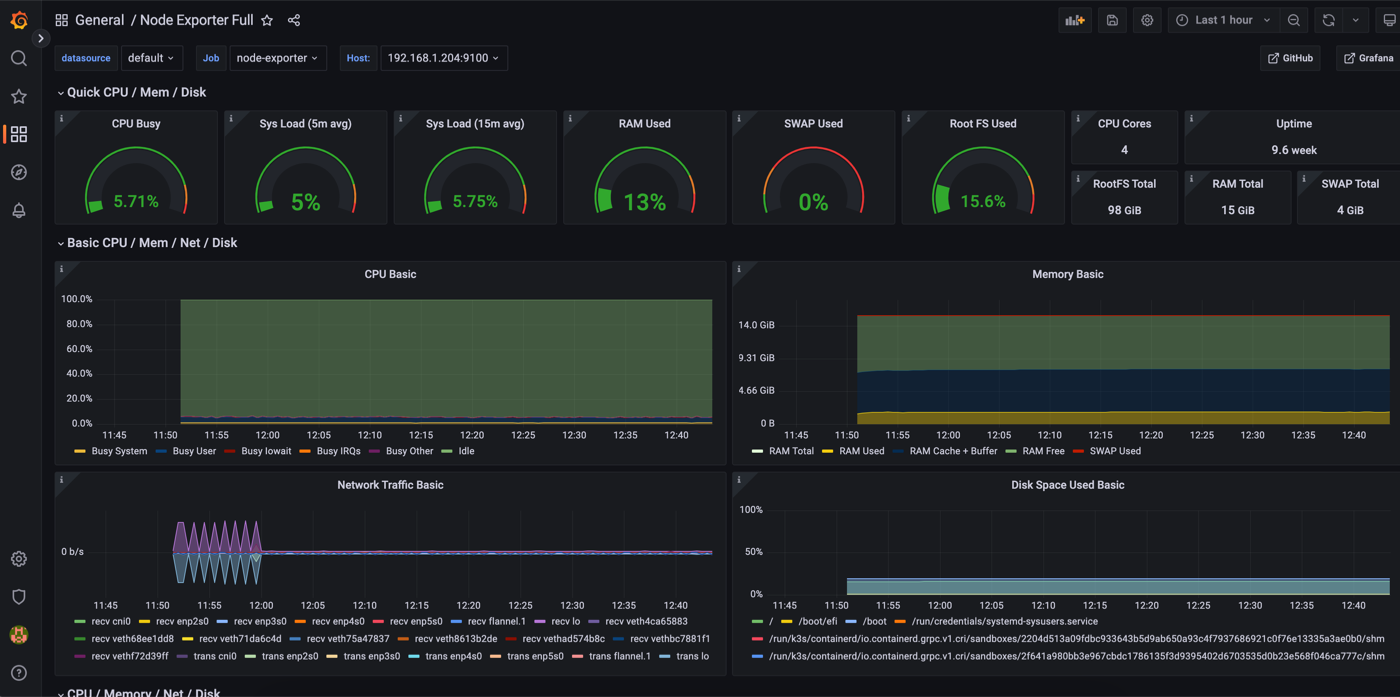
You’ll be able to see now all the resource of the node and their usage:
Thank you for reading this tutorial on how to install K3s with Prometheus and Grafana. I hope you found it useful and that it will save you valuable time in your IT projects.